1. Introduction
There are two types of energy: renewable and non-renewable energies. Non-renewable energy includes coal, gas, and oil. Non-renewable energy depends on burning fossil fuels to create energy. These sources are characterized by easy to use, easy to find anywhere. But these sources are suffering from long time-consuming processes, large amounts of carbon dioxide when burnt, and some health risks for employees. Renewable energy often referred to as clean energy, comes from natural sources or processes that are constantly replenished. Some examples of renewable energy sources are solar energy,1–3 wind energy,4–6 hydropower,7 geothermal energy,8 biomass energy,9 and fuel cell.10–12 These renewable energies have the following advantages: sustainability, low maintenance requirements, numerous health, and environmental benefits. In contrast, these sources suffer from higher upfront cost, intermittency, storage capabilities, and geographic limitations.13–15 Some renewable energy sources along with their environmental impacts will be discussed.
Solar energy comes from converting sunlight into electrical energy. Solar energy can be used in two ways: actively or passively. Active solar is immediately consumed in activities like drying clothes and heating air, and technology has created various ways to make use of this abundant resource. A few minor impacts on the environment are that materials used to manufacture PV panels can be toxic if leaked into the atmosphere. Furthermore, clearing land for massive solar arrays could have a harmful impact on the ecosystem. However, installing solar on existing rooftops and farmland can help to eliminate this impact.16
Wind energy is the generation of electrical energy through the wind, using turbines that capture wind movement and convert it into an electrical energy source. Wind energy has become one of the most cost-effective renewable energy technologies in recent years. Wind turbines that generate power nowadays use tried-and-true technology to provide a secure and long-term energy supply. Wind energy can already compete with conventional energy production in good, breezy sites.17 Many countries have vast wind resources that have yet to be used. The control schemes of wind turbine systems are not an easy issue due to the variation in the wind speed and the nature of the output power from the generators. Each wind generator has its own output along with characteristics that complicated the control techniques for wind energy systems.18 For more elaboration, there are four main types of generators used in wind energy systems. These generators are self-excited induction generators, doubly-fed induction generators, and switched-reluctance generators.19 Wind power can diminish, fragment, or damage habitat for wildlife, fish, and plants, among other things. Turbine blades are also whirling can threaten flying wildlife like birds and bats.20 Hydropower energy is the energy extracted from the flow of water so that a generator powered by turbines is installed and the water flow is converted into electrical energy. The effects of water energy on the environment lie in the use of dams, which may cause problems for fish migration.21
Geothermal energy is the heat that exists under the ground; the water and steam will carry this heat to the earth’s surface. Changes in land use connected with exploration and plant building, noise and light pollution, water and gas discharge, the formation of bad odors, and soil subsidence are all environmental repercussions of geothermal development and power generation.22
Biomass energy is a renewable energy source extracted from plant or animal wealth. This source is considered a renewable energy source because the photosynthesis process recycles carbon dioxide into a new crop. According to the EIA, carbon dioxide (CO2), a greenhouse gas, is released when fossil fuels or biomass are burned.23
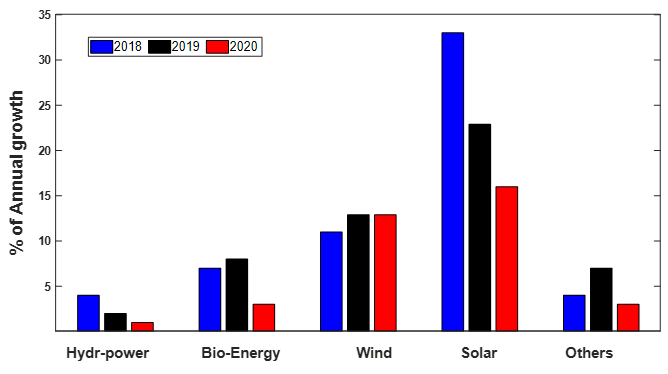
There are some combinations of these renewable sources and they are connected at a common point then connected to the grid to form so-called hybrid power systems or supply the load directly in off-grid applications. Examples of off-grid hybrid power applications are, PV/Biomass hybrid system with storage elements was presented in 24–26, Another off-grid hybrid power system consisting of PV/Wind/fuel cell was investigated in 27,28. Grid-connected hybrid power systems were introduced by many researchers with different applications and methodologies. The on-grid hybrid power systems optimal configuration with different optimization techniques were studied in 29–32. Some analysis about the percentage of generation of different renewable sources between 2018 and 2020 will be investigated (IEA).33
PV represents the highest generation level from the available renewable sources. It was 36% in 2018, while all other sources were 26%, as shown in Figure 1. The generation levels in 2019 and 2020 were reduced compared to 2018 due to Covid 19.

From this review, solar energy is the most used renewable energy source. This paper presents a review of solar energy, statistics, and applications.
2. Photovoltaic (PV) system
Solar photovoltaic produce electricity from photons that come from sunlight. PV cells contain thin semiconducting material layers with different charges between the top and bottom layers. When sunlight hits the modules on solar photovoltaic cells, the semiconducting material has electrons that absorb the photons, so electrons get energized. These move between the top and bottom layers of the semiconducting material. This movement produced direct current (DC) that can be converted to AC by some power electronic switches.34
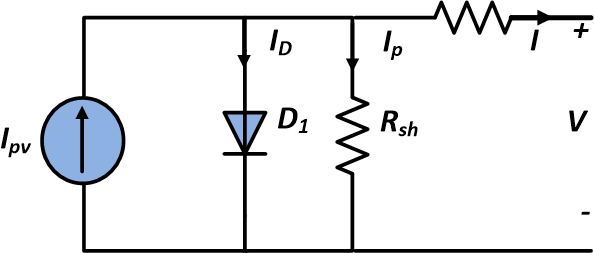
As shown in Figure 2, the PV module is modeled as a current source with diode, series, and shunt resistances.

The PV system’s I-V characteristics are represented as:
I=npIpv−nsIo[exp(V+I.Rs(nsnsh)VT)−1]−[V+I.Rs(nsnsh)Rsh(nsnsh)]
where and are the PV panel output current and voltage respectively. is the PV current; is the reverse saturation current; is the number of PV cell connected in series, and is the number of the PV cell connected in parallel. While describes resistance in series connection, and describes the resistance in parallel connection. is the thermal voltage of the module which is a function in the electron charge.
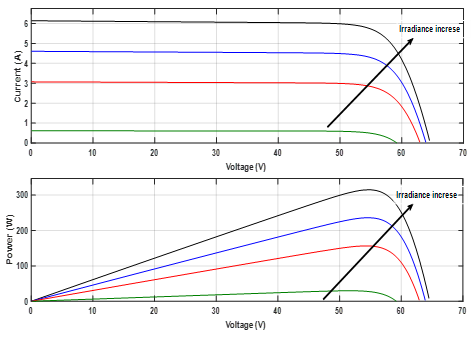
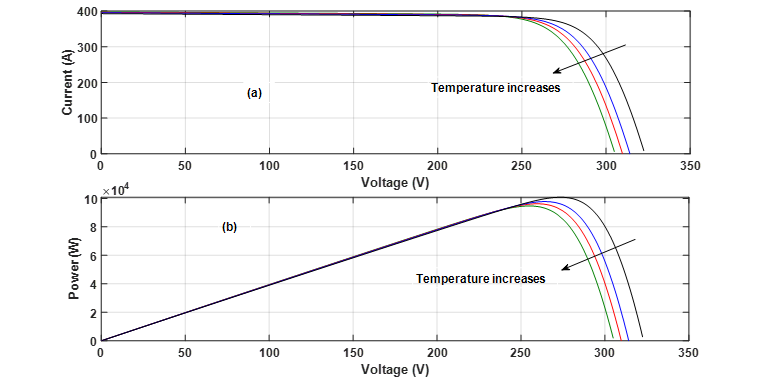
The PV has two characteristics that are I-V and P-V characteristics. These characteristics are affected by the enviromental conditions including temperature and irradiance. The effect of these two environmental conditions is shown in Figures 3 and 4.


All solar PV systems may be classified into two categories: On-grid and Off-grid systems.
2.1. On-grid system
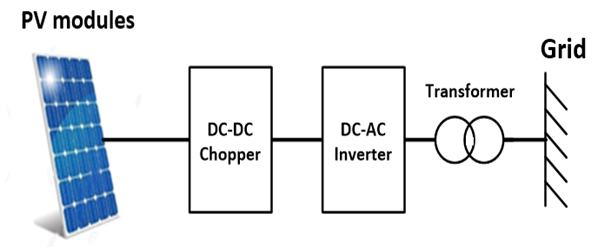
On-grid solar PV system using a solar energy source can generate electricity where it is connected to the utility grid. When sunlight strikes the solar photovoltaic cell’s modules, the modules convert the sun’s energy into electricity that can power loads; whether the electricity is drawn from a PV system or the grid load power will stay the same. The DC output of the PV system is decreased/increased by DC-DC boost/buck converters, respectively. The DC power generated from the Dc-DC converter is converted to AC through an inverter. This AC power is the standard electrical current used for most loads. The electrical current passes from the inverter to the electrical service panel, which distributes power to all loads. A tracking meter, which is available as an option, can keep track of all loads’ total electricity usage, the solar installation’s total output, and more. These tracking systems frequently include live display systems or online monitors, allowing you to keep track of how much electricity your system uses and how well it performs at any given time. If the solar system’s output exceeds the loads during the day, the excess electricity is fed back into the grid. The electrical meter will turn backward when this happens. Using more electricity than a solar installation produces at night means that the extra energy required to power the loads is sourced from the grid, as it would normally be. Using the batteries as energy storage in these on-grid systems is not an amendatory option as in case of the absence of the power from PV, the grid supplies the needed loads. A typical on-grid PV system is shown in Figure 5.35

The Advantages of the on-grid PV system are: less expensive, due to not needing batteries and other equipment, net metering offsets the electricity produced by a solar system to the electricity used from the grid during the night, and in some countries, if the solar system’s production exceeds the loads, the excess electricity is fed back into the grid so you can get profit from it. However, these systems have some drawbacks, including in case the grid goes down, the PV system will shut off beside the dependency of the grid.36
2.2. Off-grid system
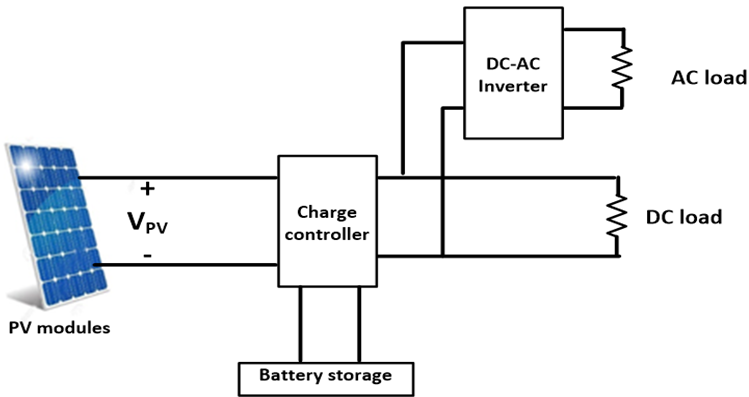
Off-grid solar PV systems are working out of the grid. The main goal of the off-grid solar PV systems is in places where the grid is not available. It is helpful in light-load applications, rural areas, street lights, street signage, and traffic lights applications. The off-grid system comprises solar panels, some converters and inverters, charger controllers and a battery bank as a storage unit. When sunlight hits the modules on solar photovoltaic cells, the modules convert the sun energy into electricity that can power the loads. The charge controller protects your battery bank from overcharging or undercharging. In normal conditions, the produced DC power will store in the battery bank to be used at night or on cloudy days. At the same time, it can use this power to feed the loads but should be converting the DC power into AC power by inverter because most loads are AC. A typical off-grid PV system is given in Figure 6.37

The optional generator is not always required; it will provide electricity. It has many types such as biodiesel, petroleum, diesel, etc. In addition, there is a system meter that measures and displays your solar PV system performance and status. The off-grid PV system has some requirements and more complexity than the on-grid type. From these requirements, mounting system, inverters, controllers, and batteries. The off-grid system is independent of the grid and useful for locations far from the transmission line of the grid. But it is costlier than the on-grid system as mandatory need for batteries along with their maintenance and relatively short lifespan. Moreover, surplus energy production could go to waste. A general comparison between on-grid and off-grid PV systems is given in Table 2.
There are also quickly increasing floating photovoltaic (FPV) systems, as shown in Figure 7. These systems are built right on the water’s edge. The water-based configuration of FPV systems can be mutually beneficial: it can lower PV operating temperatures and potentially cut solar energy generation costs, as well as reduce evaporation and algae growth. These floating systems are characterized by Higher land-use efficiency, Increased energy yield, Lower module degradation, reduced water evaporation, improved water quality, reduced algae growth, less prone to dust pollution and Ease of installation.38

3. Global solar PV market and generating levels
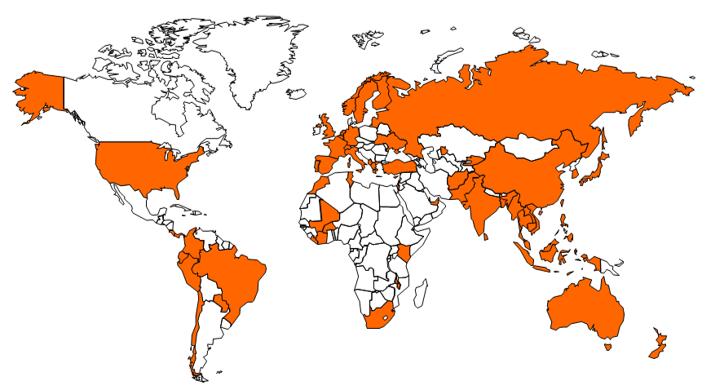
FPV panels, along with PV panels installed on the ground and on the roof, are among the most important pillars in the global solar PV market. Currently, more than 60 countries are seeking to expand or deploy the FPV as shown on the map Figure 4. More than 350 operating FPV systems are spread across more than 35 nations, with a total capacity of around 2.6 GW as of the end of August 2020. Although still considered a niche, FPV is expected to develop at a rate of more than 20% per year over the next five years. Asia is predicted to represent nearly two-thirds of worldwide demand, with China, India, South Korea, Taiwan, Thailand, and Vietnam leading the way.39
China is now the largest market in the world of floating photovoltaic panels, As a result, it is eligible for a 20-year FIT or as a “grid-parity” project. China’s Datang Power issued a tender in June this year, seeking multiple proposals for a total capacity of 820 MW of FPV to be installed across China by December 2021.40 India’s domestic solar PV sector is one of the most competitive in the world, with bid costs for FPV tenders dropping by 45 percent between 2016 and 2018. There are various causes for such a low offer, including improvements in manufacturing techniques, material cost reductions, floater thickness reductions, and aggressive bidding by developers seeking FPV experience. Given that the Indian government issued a series of bids for FPV systems totaling around 2 GW between 2018 and 2019, the latter could be the key reason. Around 1.7 GW is now under various phases of development.41
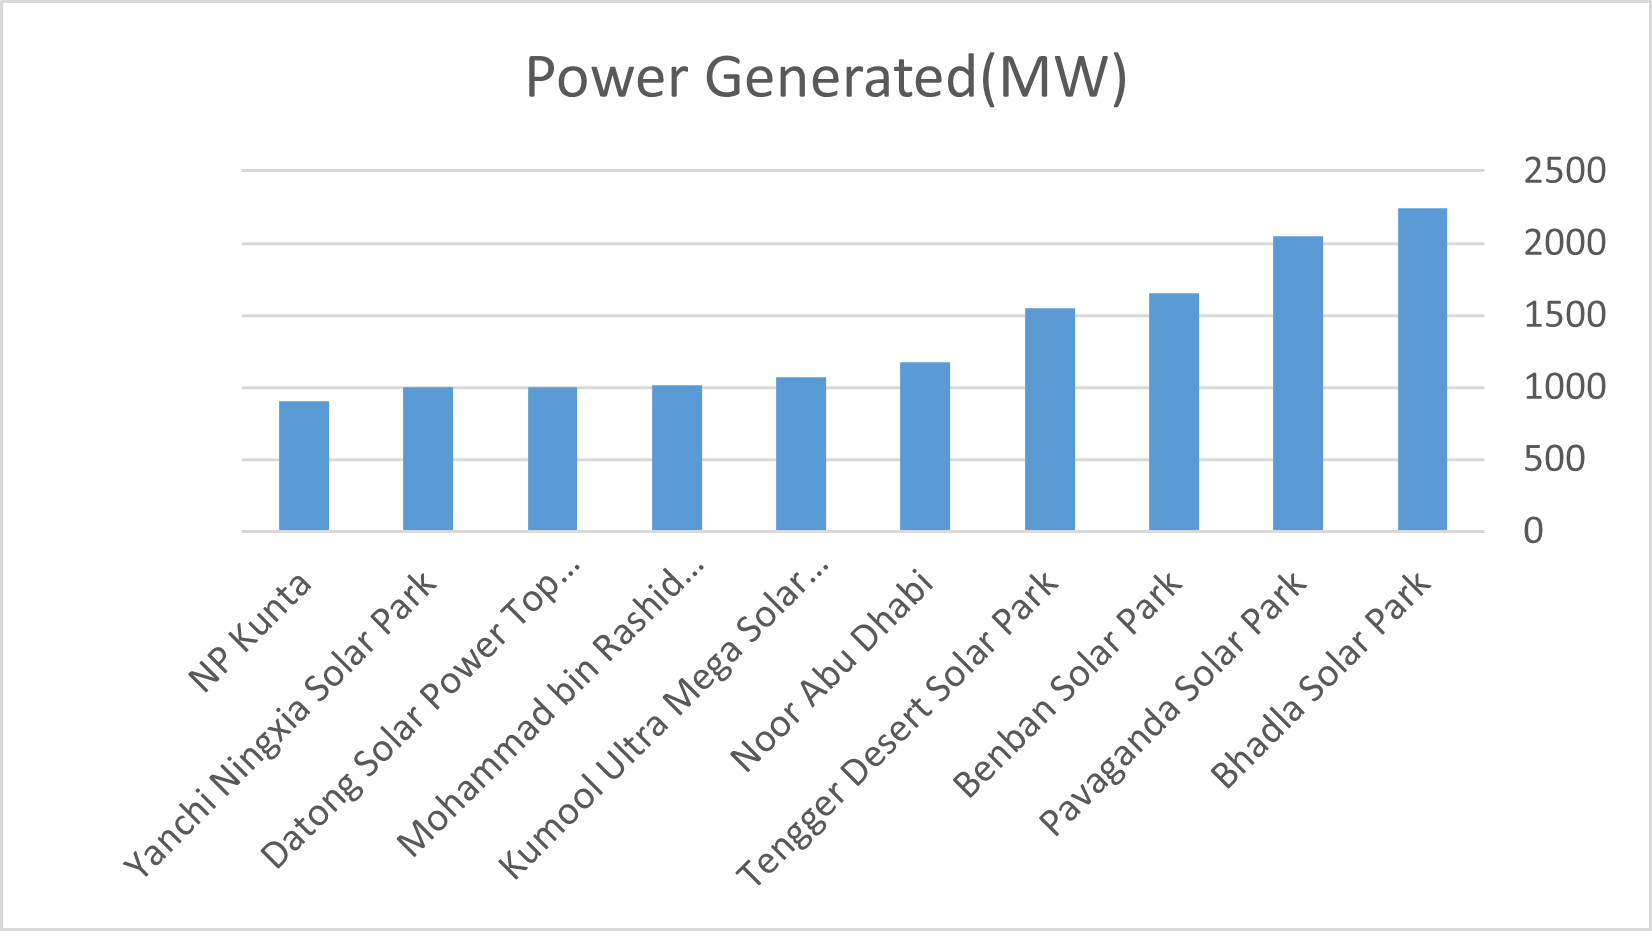
This section describes generation development in some countries, as well as India, China, the United Arab Emirates, and Egypt. Due to low production or restricted changes in market development, not all nations are covered in this research. Generally, the Solar PV system is considered the cheapest form of electricity generation in many countries and markets. India is the number one country of leading Electricity generation from solar plants in 2020 by 2245MW and then Egypt, China with 1650, 1547 MW. Table 3 shows the generation levels of these countries.

In Southeast Asia, Thailand is the largest producer of solar energy. Solar capacity has grown from 1299 MW in 2014 to 2021 MW in 2015 as it ended 2016 with over 2800 MW, which is higher than all other Southeast Asian countries combined. Its goal is to install 6000 MW by 2036.
In Singapore in 2015, the installed capacity of the solar power system was almost 60 MW and it doubled at the end of 2016 to 126 MW. Singapore plans to install 350 MW by 2020.42
India is the number one country leading electricity generation from solar plants in 2020. By 2022, 100 GW by 2030, and 200 GW by 2050, India will build a solar generation capacity of 20 GW, 100 GW, and 200 GW, respectively, as shown in Table 4.43
In just nine months in 2017, China installed 43 GW of solar electricity. As a result, China’s government increased its objective to 213 GW by 2020, more than doubling the previous target. Table 5 shows that solar power contributed 118.2 TWh of the 6,412 TWh energy produced in China in 2017, accounting for 1.84 percent of total electricity output, up from 40 GW in 2017.44
Solar electricity generation in the Eurozone was estimated to be 44.8 TWh in 2011, with 51.4 GW of installed capacity. In Italy, solar electricity accounted for roughly 3.6 percent, 3.1 percent in Germany, and 2.6 percent in Spain. According to Euro Observer, the total installed capacity will be at least 120 GW in 2020, as shown in Table 6.45
Africa’s development vision recognizes that improving access to affordable and dependable electricity is critical to achieving the desired social and economic success. Egypt and South Africa, Table 7.46
In 2017, Egypt has made considerable progress in the field of renewable energy promotes solar energy in the rest of Africa. The country is setting itself up as a model. In the wake of its many solar projects such as Benban Solar Park is in pole position. The Egyptian authorities plan to produce 20% of the country’s electricity from renewable energy sources by 2022.47
Solar thermal and photovoltaic energy production achieved a new high of 72.2 GW hours in the United States of America by 2019. By the end of 2018, the country has around 62.7 GW of cumulative PV capacity.48
In 2018, PV electricity systems generated roughly 15.4 TWh, or 5.9% of total electricity demand in Australia. The total share of renewable electricity was 18.9% in 2010, and it is expected to rise to 20% by 2020. The largest five solar farms in Australia are shown in Table 9.49
4. Conclusions
This paper presents an overview of some different types of renewable energy sources either for on-grid or off-grid applications. In addition, this is paper provides an overview of solar cells, their importance, and the extent of their global spread for those interested in the fields of solar energy work. Besides the paper also provides a compilation of some statistics on most countries and continents producing solar energy.