1. INTRODUCTION
2,2,2-trifluoroacetophenone (C6H5COCF3, TFAP), which is also known as perfluoroacetophenone. is a fluorinated analogue of acetophenone (C6H5COCH3, AP) that is used for the synthesis of many pharmaceuticals.1,2 TFAP is regarded as an efficient, inexpensive, environmentally friendly, mild, fast, and sustainable organocatalyst for the oxidation of alkenes to corresponding epoxides,3,4 the oxidation of azines and tertiary amines to corresponding nitrogen oxides,5,6 enantionselective hydrogenation,6,7 and aldol reactions.8 It is also used for the synthesis of thermally stable fluorinated polymers that have good film-forming properties.8
The study of the molecular structure and spectral properties of TFAP has attracted attention in recent years due to its catalytic and biological activities. The surface vibrational spectroscopy of TFAP adsorbed on the surface of platinum was reported using high resolution energy loss spectroscopy.9 Recently, the rotational spectrum of TFAP using supersonic Fourier transform microwave spectroscopy has been reported.10 Dey and his co-workers, reported the crystal structure of TFAP obtained from an in situ cryo-crystallization technique.11 It has been found that incorporation of fluorine atoms into macromolecules even with a slight difference leads to polymers with enhanced chemical resistance, thermal stability, glass transition temperature and solubility.8 Similarly, the catalytic efficiency of epoxidation reactions using fluoroalkyl ketones is found to be affected by introducing a slight difference in molecular structures of this class of compounds.4,12 The trifluoromethyl (CF3) moiety is also reported to have played a crucial role in the modification and enhancement of the biological activities of trifluoromethylated organic compounds.13,14 Thus, an accurate understanding of the structures of fluoroalkyl ketones is desirable for the development of structure-activity relationships of fluorinated catalysts and polymers
Owing to the important applications of the TFAP molecule, the present study explores the theoretical molecular structure, electronic properties and infrared spectrum of TFAP. The results are compared to the TFAP experimental data that is currently available. In addition, the calculated parameters are compared with those of acetophenone so as to establish the effect of substituting the methyl groups with an electron-withdrawing trifluoromethyl (CF3) group.
2. EXPERIMENTAL
2.1. COMPUTATIONAL METHODS
The initial molecular structure of TFAP was modelled using the graphical interface of the Gauss-View software15 and then subjected to geometry optimization, atomic charges and frequency calculations. All calculations were carried out with the Gaussian 09 simulation package,16 employing Density Functional Theory DFT-B3LYP/6-311++G(d,p) method.17,18 The DFT method has been reliably used for the calculation of the structural parameters, electronic and vibrational spectra of organic compounds.19–21
The calculated wavenumbers and intensities were used to simulate infrared spectra. Furthermore, at the same level of theory, the frontier molecular orbitals, namely the HOMO (highest occupied molecular orbital) and LUMO (lowest unoccupied molecular orbital), and molecular electrostatic potentials (MEP) for TFAP are generated. As previously described,22 the HOMO and LUMO energy values are used to calculate electronic properties such as, HOMO-LUMO energy gaps, electron affinity, electronegativity, and ionization potentials. For comparison, the electronic properties of AP are calculated at the same level of theory.
3. RESULTS AND DISCUSSIONS
3.1. STRUCTURAL PARAMETER
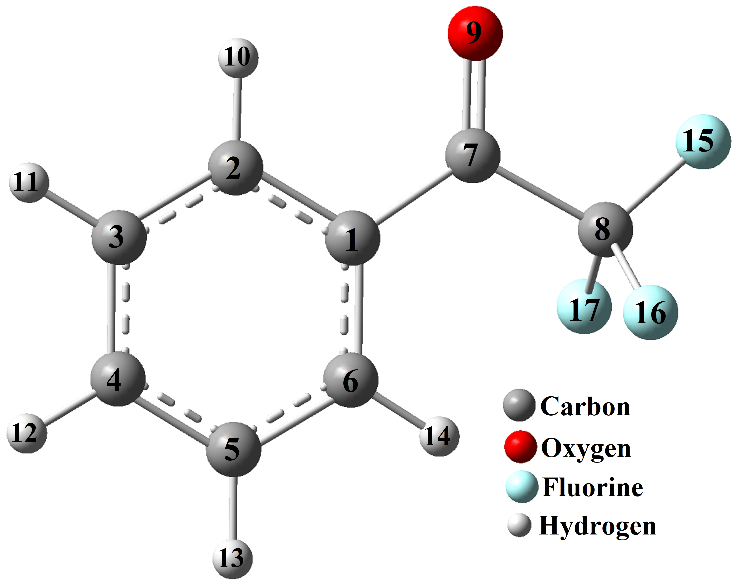
TFAP is a structural analogue of acetophenone (AP, C6H5COCH3) where the methyl group of AP is substituted with CF3 (Figure 1). Thus, TFAP is a trifluoroacetyl bearing organic compound with the trifluoroacetyl (COCF3) functional group attached to an aromatic benzene ring as shown in Figure 1. The optimized structure of TFAP is presented in Figure 1 along with the numbering of atoms. Some of the calculated structural parameters are presented in Table 1, along with the X-ray diffraction experimental data11 for comparison. The calculated Root Mean Square Deviation (RMSD) from the experimental values shows that the calculated values are in good agreement with the experimental values. The RMSD values for the bond length, bond angles, and dihedral angles are calculated to be 0.075, 0.10, and 3.42, respectively.

The TFAP molecule adopts a planar configuration with the COCF3 group on the top of the plane of planarity. The endocyclic CCC bond angles of the phenyl ring were calculated to be around 120° with the highest deviation of 0.6° at C6C1C2. Similarly, the C1−C2 bond length is calculated and experimentally observed to be longer than other C−C bond lengths of the phenyl ring. These deviations are due to the COCF3 substituent on C1 of the aromatic ring. The carbonyl (C=O) bond length, which is calculated to be 1.207Å, is typical of carbonyl bond length and is in agreement with the experimental value of 1.211Å. The calculated C−F bond lengths of the CF3 moiety are also in agreement with the experimental values (Table 1). In general, the calculated geometrical parameters are consistent with the X-ray diffraction11 and rotational spectrum10 analyses, which claim that the backbone of the TFAP molecule is mainly planar.
It is opined that the intramolecular interactions between the phenyl hydrogen atom (H14) attached to C6 and the fluorine atoms of the CF3 group contributed to the stability of the structure of TFAP.11 The C6H6-----F15 and C6H6-----F17 interactions, which were experimentally determined to be 2.480 and 2.550Å are calculated to be 2.4782 and 2.4784Å respectively. This could be the reason for the slight elongation of C8−F15 and C8−F17 bond lengths (1.354Å) compared to the C8−F16 bond length (1.330Å).
3.2. ELECTRONIC PROPERTIES
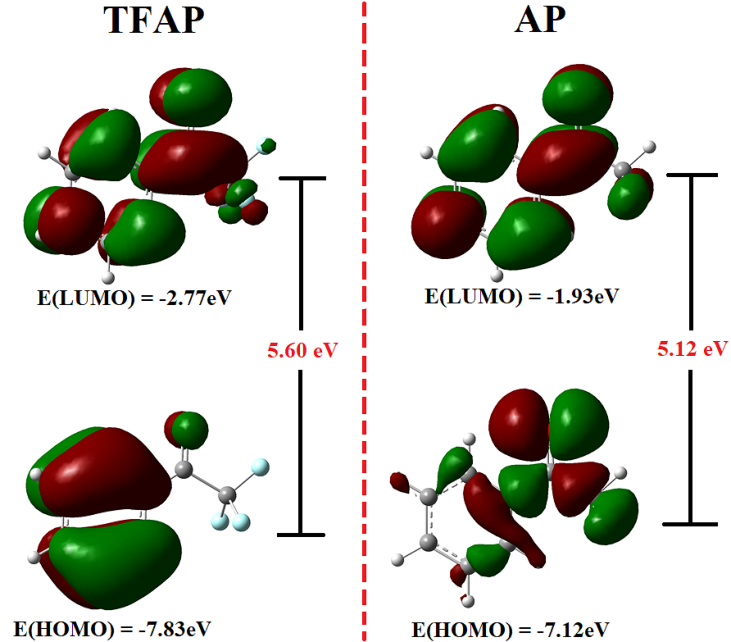
The features of the frontier molecular orbitals (HOMO and the LUMO) are highly effective in determining the most reactive position in aromatic systems. They can also be used to describe a variety of conjugated system reactions.22–24 The HOMO and LUMO of TFAP are illustrated in Figure 2 along with those of AP for comparison. The LUMO of both molecules (TFAP and AP) is delocalized over the entire molecules. The HOMO of TFAP is localized on the phenyl ring and oxygen atom of the carbonyl functional group. In the case of AP, the HOMO is localized mainly on the trifluoroacetyl (COCF3) group and part of the phenyl ring.

The HOMO is associated with the ability to donate an electron, whereas the LUMO is associated with the electron acceptance. Thus, HOMO energy is proportional to ionization potential, LUMO energy to electron affinity, and the HOMO-LUMO energy gap is related to the chemical stability of the molecule. Polarizable and chemically reactive molecules have small HOMO-LUMO energy gap.19–21 The HOMO-LUMO energy gap was calculated to be 5.06 eV for TFAP and 5.12 eV for AP. The ionization potentials, electron affinity, and electronegativity for TFAP/AP were determined to be 7.83/7.12 eV, 2.77/1.93 eV, and 5.30/4.53 eV, respectively. Thus, the introduction of the CF3 group in the structure of the AP decreases the HUMO-LUMO energy gap but increases electron affinity, ionization potential, and electronegativity of the molecule due to the CF3 moiety’s electron withdrawing effect.
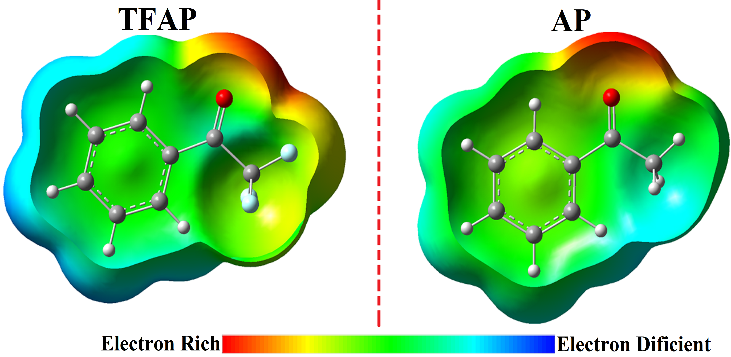
Figure 3 depicts the MEP surface of TFAP in comparison to that of AP. The optimized geometry of the molecules is used to generate the MEP surfaces. MEP is used extensively in the study of molecular interactions, the prediction of relative locations for nucleophilic and electrophilic attacks, molecular clusters, and the prediction of a variety of macroscopic features.25–27 Different colors are used to represent MEP surfaces; red is associated with negative potentials and reflects electrophilicity, blue is associated with positive potentials and reflects nucleophilicity, and green is associated with zero electrostatic potential.

The MEP surface of TFAP is slightly different from that of AP due to the electron withdrawing effect of the CF3 moiety. The negative electrostatic potential (red) region for AP is localized on the carbonyl oxygen atom, while for TFAP it is extended to the CF3 moiety. Thus, the CF3 moiety reduces the electron density around the carbonyl oxygen atom. For both molecules, the positive electron potentials are around the hydrogen atoms of the molecules. In addition, the phenyl rings of both molecules have an electrostatic potential (green region) that corresponds to midway between red and blue, a potential site for intermolecular interactions. The MEP surface of TFAP is in agreement with the calculated atomic charges of the optimized structure of TFAP (Figure 4).

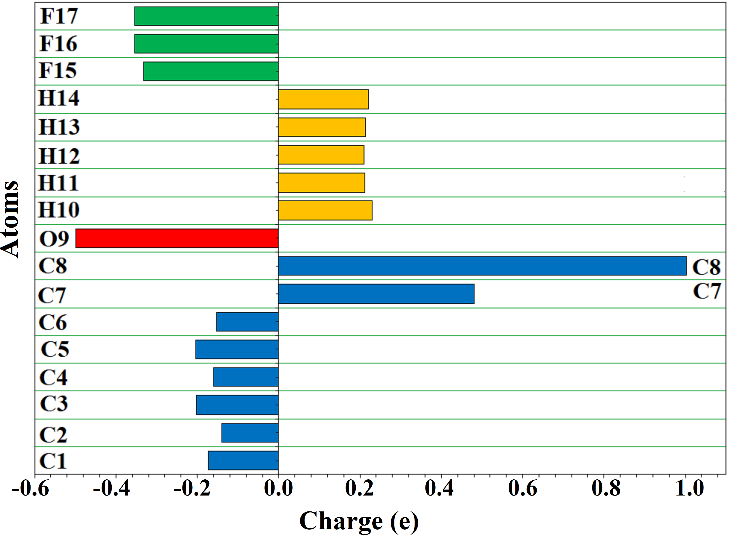
Figure 4 depicts the atomic charges for TFAP atoms obtained from B3LYP/6-311++G(d, p) optimized geometrical structures of the molecules using the Gaussian 09 NBO method. Positive charges are mostly found on hydrogen atoms (ranging from 0.210 to 0.230e), whereas carbon atoms are either positively or negatively charged. All the carbon atoms (C1 – C6) of the phenyl ring are negatively charged with a value in the range of -0.140 to -0.204 e. The atomic charges of the carbonyl (C7) and trifluoromethyl carbon (C8) atoms are calculated to be +0.481e and +1.002e, respectively. The positive charge of C7 and C8 is attributed to the electronegative effect of carbonyl oxygen atoms and fluorine atoms, respectively. The C8 is more positive due to the synergistic effect of the partial polar nature of the carbonyl group (C=O) and the inductive effect of the three fluorine atoms of the CF3 moiety. The atomic charge of the oxygen atom is -0.499e, and the fluorine atoms are also negatively charged, with an atomic charge value of -0.332e for F15, -0.332e for F16, and -0.354e for F17. In general, the result suggests that the trifluoroacetyl group of TFAP is an electron acceptor, and the result is consistent with the MEP surface of the molecule (Figure 3).
3.3. VIBRATIONAL SPECTRAL ANALYSIS
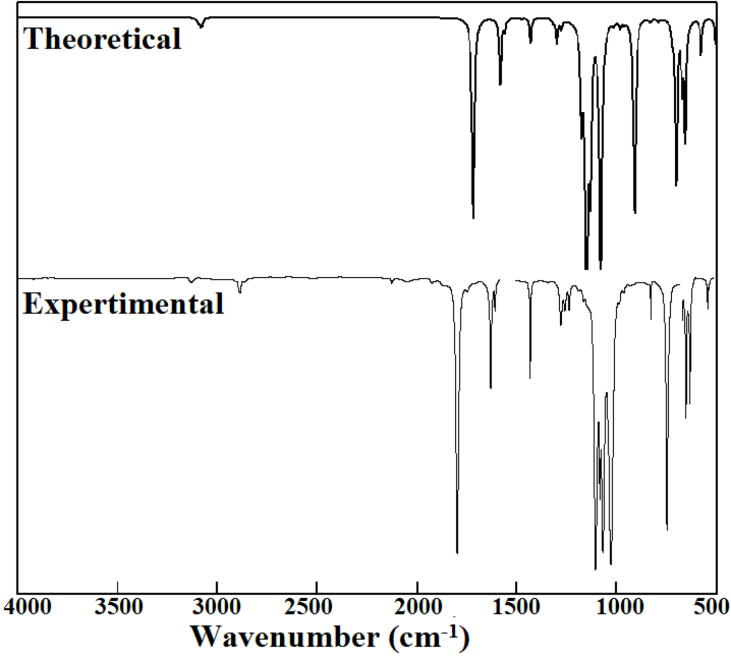
The geometrical parameters obtained from the optimized structure of TFAP are used to calculate the wavenumbers along with their corresponding intensities that are used for the simulation of the IR spectrum of the molecule. It is important to note that all calculated vibration wavenumbers are positive, which confirms that the optimized structure (Figure 1) is indeed the minimum energy structure of the molecule. The calculated vibrational wavenumbers are scaled by a factor 0.9668.19 The assignments of vibrational modes are proposed on the basis of potential energy distribution (PED) using VEDA4 program28 and the PED with a contribution of at least 10% are presented in the last column of Table 2. The vibrational wavenumbers calculated in the range of 3109–3065 cm-1 and observed at 3067 cm-1 are attributed to the C-H (symmetric and asymmetric vibrations) of the phenyl ring. These are mainly CH vibrational modes with about 91-95% contributions to the PED. The high intensity peak calculated to be at 1718 cm-1 and experimentally observed at around 1724 cm-1 is assigned to the stretching mode of the carbonyl (CO) functional group of the molecule. This mainly CO stretching mode with about 90% contribution to PED.
The simulated IR spectrum of TFAP along with the experimental spectrum29 is provided in Figure 5. The figure illustrates the characteristic peaks in the TFAP molecule. TFAP is a CF3-bearing organic compound with a COCF3 functional group directly attached to aromatic phenyl ring.

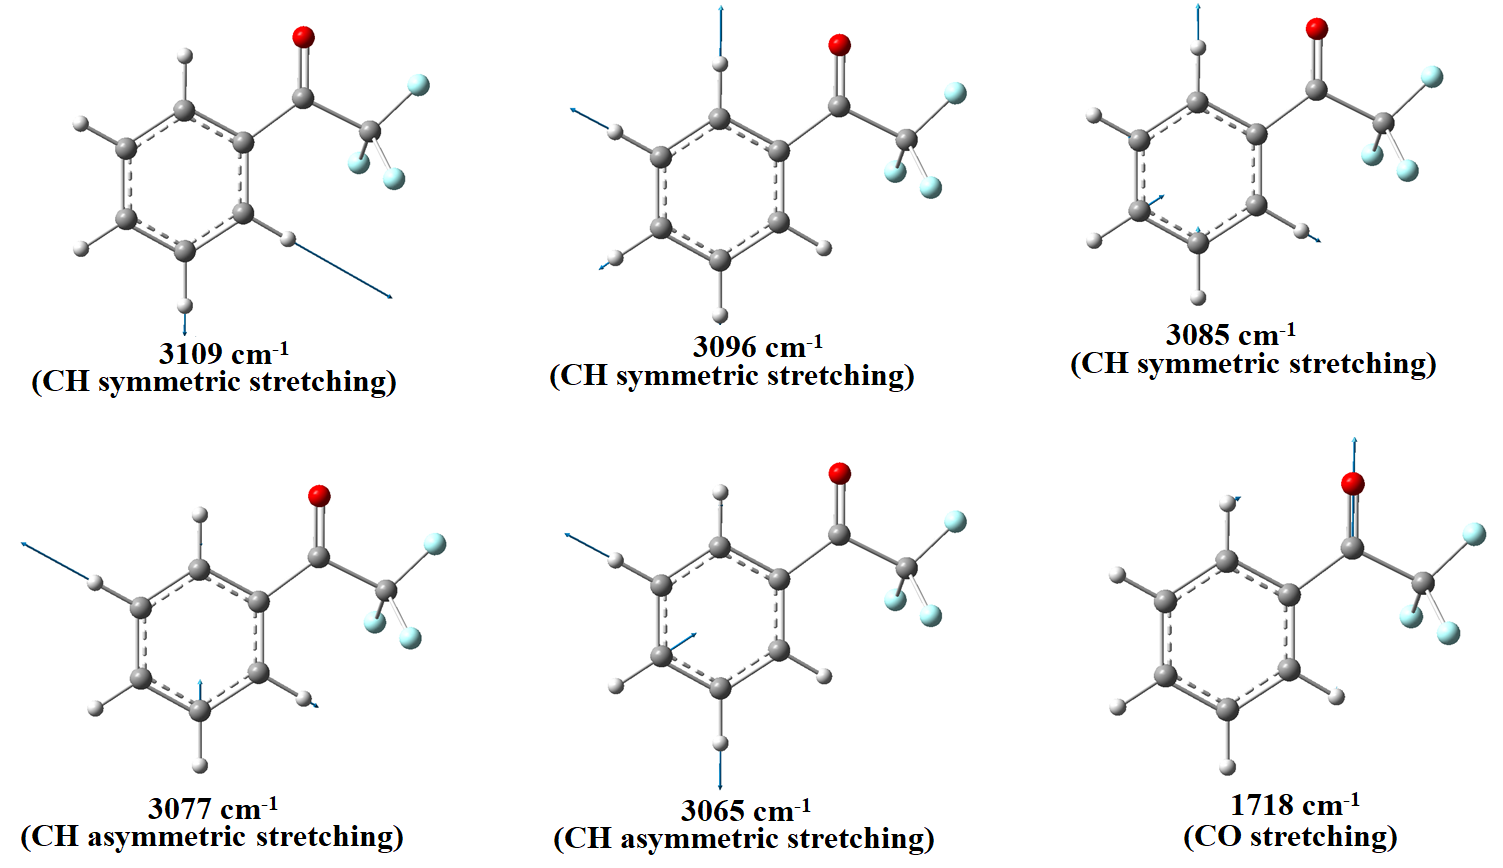
The stretching modes associated with the C-H vibrations of the phenyl ring and C=O of the carbonyl functional group generated by the Gauss-View program are illustrated in Figure 6. As evident from the figure, the vibrational modes at around 3100 cm-1 are attributed to the CH symmetric and asymmetric modes of the phenyl ring, and the vibrational peak at 1718 cm-1 is due to the CO stretching mode.

4. CONCLUSION
The molecular structure, electronic properties, and vibrational spectrum of efficient and green organic catalyst, TFAP, are theoretically analyzed using the B3LYP/6-311++G(d,p) level of theory. The calculated structural geometries show that the molecule adopts a planar configuration, and this is in agreement with the experimental X-ray diffraction and rotational spectrum analyses. The electronic properties of TFAP were compared with those of AP, a structural analogue of TFAP. The result shows that the introduction of the CF3 group into the structure of the AP decreases the HUMO-LUMO energy gap but increases electron affinity, ionization potential, and electronegativity of the molecule due to the electron withdrawing effect of the CF3 moiety. This study provides precise and valuable data that will aid in the understanding of the molecular structures, electronic and spectral properties of TFAP, which could be useful for the synthesis of new efficient and effective fluorinated based organocatalysts.