
1. Introduction
Due to their biodegradability, non-toxicity, availability, low cost, and potential wide variety of uses, specifically in the areas of biomaterials and packaging, biodegradable polymers are becoming more and more popular.1 Renewable-source polymers can ensure the long-term viability of environmentally and economically appealing technologies. These polymers are completely biodegradable, which help to reduce their environmental impact. Waste volume and climate protection are improved by lowering carbon dioxide emissions. Because synthetic materials are widely used, there is a great deal of interest in replacing some or even a large portion of them by producing polymers from biodegradable materials and then combining them with other materials. It is possible to create new biomaterials by combining highly compatible biopolymers.2 Films made from a combination of biopolymers typically have better properties than single biopolymer films. The incorporation of well-dispersed nanofillers into a polymeric matrix may improve the mechanical, optical, thermal, and barrier properties of the resulting bio-nanocomposites.3 In order to compete with fossil-derived materials, biopolymers must improve certain properties to be considered a viable alternative to conventional plastics.4,5 One such property is their poor heat resistance. Films made from a combination of biopolymers typically have better properties than those made from a single biopolymer.6
Nanocellulose is a promising material with a wide range of applications. Its distinctive characteristics include a large surface area, a high length to width ratio, excellent optical properties, rigidity, and the ability to form interconnecting structures.7 Cellulose nanofibers (CNFs) are nanoscale materials that contain both crystalline and non-crystalline regions. CNF have a width of 10-50 nanometers and a length of several micrometres, and they are connected by hydrogen bonding.8,9 Non-food applications for starch-based products are growing in popularity, despite the fact that synthetic polymers have traditionally been used in these applications. Granular starch as a filler or disrupted starch in thermoplastic materials has sparked worldwide interest in the use of starch to improve plastic biodegradability.10 It’s true that starch-filled plastics are digested by bacteria and fungi; however, up to 95 percent of the material is not degraded by any biological activity.11
In order to melt granular starch below the decomposition temperature, a nonaqueous plasticizer (generally polyols such as glycerol) must be added. This method yields granular starch with a completely disordered molecular structure or a continuous polymeric entangled starch phase called thermoplastic starch (TPS) or destructured starch.10 Furthermore, because of their abundance of renewable raw materials that are not dependent on fossil fuels, as well as their low cost, these materials have the potential to benefit both the environment and the economy. Plasticizers are extremely small molecules that enter between adjacent molecular chains, reducing intermolecular and intramolecular interactions and increasing flexibility.4
The development of antimicrobial packaging paper by Gottesman et al. was based on the direct coating of silver nanoparticles with ultrasonic radiation.12 It has been discovered that this will significantly improve the barrier properties. Amni and coworkers have developed a material with a specific food packaging application by functionalizing cellulose nanofiber with silver nanoparticle and coating onto paper surface.13 In the present study, we synthesize the silver nanoparticle using ashwagandha extract and impregnate the nanofiber of cellulose to create antimicrobial films. Due to the presence of natural antioxidants that act as reducing agents, free radical scavengers, and quechins of singlet O2, Withania somnifera (Ashwagandha), a medicinal herb, offers a wide range of therapeutic potential. The medicinal plants’ antioxidant capacity is due to bioactive compounds like flavonoids, isoflavanoids, anthocyanins, coumarins, catechins and isocatechins.14 Withania somnifera (L.) Dunal, (Solanaceae), commonly known as ashwagandha or winter cherry, is a well-known medicinal plant in Ayurvedic medicine. The principal active compounds include several withanolide type compounds. Due to the nontoxic and high medicinal value of W. somnifera, this plant is widely used all over the world. Roots, and less often leaves and fruits, have been used as phytomedicines in the form of decoction, infusions, ointment, powder, and syrup. Nowadays, this plant is cultivated as a crop to support the high demand of biomass and a sustainable quality for the needs of pharmaceutical industry.15 Utilizing natural resources for synthesis, reduces the environmental impact by minimizing the use of hazardous chemicals. Green synthesis often employs biological extracts, enhancing the biocompatibility of silver nanoparticles, making them suitable for various applications in medicine and biology. The process typically involves readily available bioresources, contributing to lower production costs compared to traditional chemical methods. Green synthesis promotes sustainability by using renewable resources, aligning with the principles of eco-friendliness.16–19 The major objective of the present paper is to develop an antibacterial starch nanocomposite by incorporating silver nanoparticles. The silver nanoparticles were synthesized from silver nitrate mediated by withanina somnifera extract via green synthesis. In current work, starch nanocomposite was prepared by incorporating cellulose nanofiber decorated with nano silver. The composites were characterized by analyzing their morphology and barrier performances.
2. Materials and Methods
2.1. Materials Used
Withania somnifera (Ashwagandha) leaves were collected from local markets of Chalakudy, Thrissur, Kerala, India. Cellulose nanofiber were isolated from pineapple leaf and was already reported.20 Potato starch, glycerol (98% purity), sodium hydroxide, oxalic acid, hydrogen peroxide, silver nitrate (AgNO3) were supplied by Merck India Pvt. Ltd. All chemicals are of analytical standard and used without any further modification.
2.2. Green synthesis of colloidal silver nanoparticles
Fresh leaves of Withania somnifera were used to prepare aqueous extract. About 30 g of fresh leaves were thoroughly washed thrice with distilled water followed by washing with double distilled water until it is free from dust and other contaminants.21 The finely chopped leaves were transferred to 250 ml Erlenmeyer conical flask with 100 ml double distilled water. The whole unit then incubated in a sand bath for 30 minutes to accelerate the formation of aqueous leaf extract. The resulting extract then filtered through Whatman filter paper 1. It is then stored in refrigerator at 4°C for further use.
For the preparation of 0.1mM silver nitrate (AgNO3), 0.042 g of AgNO3 mixed thoroughly with 100 ml double distilled water for 1 hour. The solution is then stored in an amber colour bottle to prevent silver auto-oxidation. The yield of prepared silver nanoparticles is 41.3 mg/ml. For the synthesis of silver nanoparticle, the prepared Aswagandha leaf extract and 1 mM AgNO3 were mixed at 1:4 ratio and continuously stirred at 80°C until colour change observed. This is primary confirmation of the formation of Aswagandha silver nanoparticle (AsAgNp).
2.3. Synthesis of silver nanoparticles (AgNP’s) decorated cellulose nanofibers
Cellulose nanofibers (CNF) were isolated from post harvested pineapple leaf which was already reported. Briefly, finely chopped dried pineapple leaves were subjected to steam explosion using 2% NaOH solution in an autoclave kept under 138 kPa pressure for 1 hour. The pressure was released suddenly and process repeated 3-4 times. The resultant slurry washed with double distilled water until no alkali content was present. The slurry then bleached using mixture of equal parts of NaOH/glacial acetic acid (27 g/L and 78.5 g/L respectively) and hydrogen peroxide. The bleaching was repeated until the slurry turned to white colour. It was then soaked and washed using double distilled water several times and dried in an air circulating oven. The fibers then subjected to mild acid hydrolysis using 11% oxalic acid in an autoclave set at 138 kPa, centrifuged and homogenized to get the nanofiber suspension.20
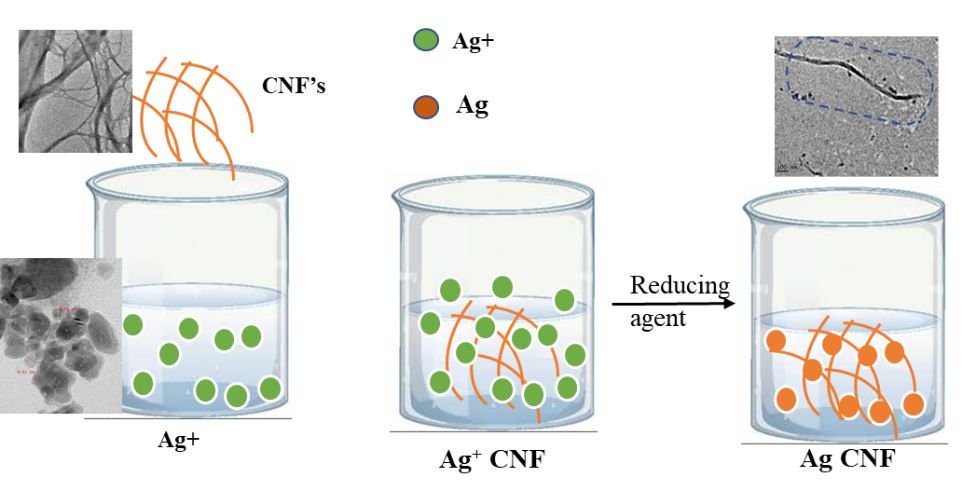
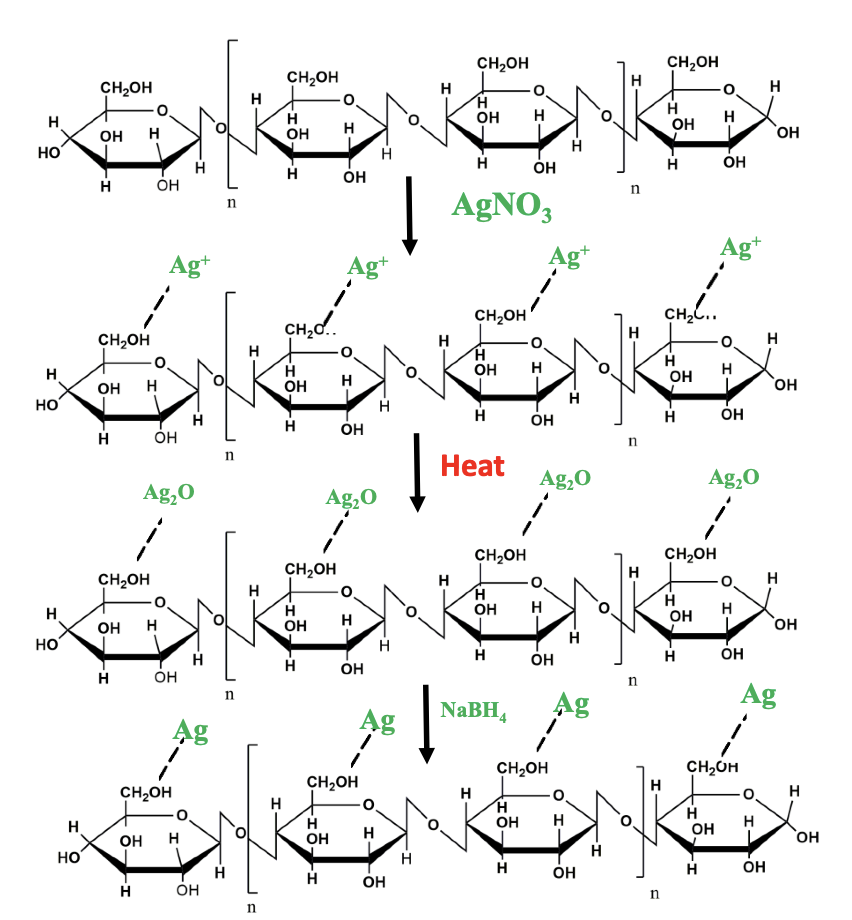
The procedure to modify CNF with silver nanoparticles were adapted from Chen et al with slight modification.22 Two grams of CNF was added to 50 ml of Milli-Q water and mixed thoroughly using a bath sonicator (PCI Analytics Ultrasonic Bath Sonicator 1.5 Ltr) for about 1 hour to disperse the CNF in the solution. For the synthesis of plant mediated silver nanoparticles, the leaf extract and 1mM silver nitrate solution were taken in 1:4 ratio respectively and stirred on the hot plate at 60°C for 30 minutes until the color change was observed. This indicates the preliminary confirmation for the formation of Ashwagandha silver nanoparticles (As-Ag Nanoparticles). The silver ion-saturated CNF films were placed in 0.1 M NaBH4 solution for 10 min in an ice bath, and the color of the films gradually changed from bright yellow to brownish colour (Figure 1). The CNF-AgNP nanocomposites were rinsed with Milli-Q water to remove the excessive chemicals on the films.

2.4. Fabrication of nanocomposites
Nanocomposites with starch matrix were fabricated by solvent casting technique. Briefly, cellulose nanofiber/AgNP decorated nanofibers were dispersed in 100 ml double distilled water and bath sonicated for 30 minutes. To this homogenous solution, add required amount of potato starch and 30 wt.% of glycerol (on dry starch basis), were added and mixed using a mechanical stirrer (REMI RQ-124 A/D) at 90 °C and 700 rpm until solution become viscous to get plasticized starch (PS). It was then slowly poured to levelled petridishes and kept in an air circulating oven for 12 hours until it is completely dry. The sample code and formulations were given in table 1.
3. Experimental methods
3.1. UV-Vis Spectroscopy
UV-Vis spectra of prepared AgNP were measured using a TU-1901 model UV-Vis double beam spectrophotometer (Beijing Purkinje General Instrument Co., Ltd, China). The scan speed used in the analysis was 240 nm/min, and three replicates of each material were measured.23
3.2. Fourier Transmission infrared spectroscopy
FTIR spectra were recorded using a Shimadzu IR-470 IR spectrometer. AgNP decorated nanofibers were dried in an air circulating oven at 50°C. The spectrum of each sample was analysed at a range of 400-4500 cm-1 with a resolution of 2 cm-1. Total of 4 scans per each sample were taken.
3.3. Scanning electron microscopy and field emission scanning electron microscopy
Scanning electron microscopy (JEOL JSM-820 model) was used to study the surface morphology of fibers after each treatment and fracture surface of nanocomposites. The samples were coated with gold using a vacuum sputter coater to avoid charring during SEM prior to the analysis. The accelerating voltage was 15 kV. In order to understand the fracture behaviour nanocomposite specimens were first frozen in liquid nitrogen and then immediately fractured.
The microtopographies of acid treated CNF samples and AgNP’s decorated cellulose nanofibers were observed by FESEM. The FESEM micrographs were taken on a Zeiss Supra 35 VP. For the FESEM, about 30 mg of the well sonicated samples were dispersed in 50 ml of acetone (Ultrasonic Processor UP400S, Hielscher). The suspension was applied to a glass substrate from which the acetone quickly evaporated. The dried glass support with its CNF particles on the surface was then coated with gold and used for FESEM observations.
3.4. Transmission Electron Microscopy
The morphology of the cellulose nanofiber and modified fiber was analyzed by TEM (JEM-2100HRTEM). The nanofiber suspension was subjected to ultrasonic treatment for 30 minutes to disperse the nanofibers. A drop of dilute solution was drop cast on the surface of the clean copper grid and coated with a carbon film. The grid dried in sodium vapor lamp for 4 hours before imaging.
3.5. Water vapor transmission rate (WVTR)
The films’ WVTR was calculated using the desiccant method in accordance with ASTM E96-95 standard. The films were cut into a circle measuring 6.3 cm in diameter, sealed with silicone grease onto an aluminum permeation cup holding 45 g of dry calcium chloride, and then secured with a ring. The entire apparatus was weighed before being placed in a chamber with controlled temperature and humidity (23±2°C and 50±5% RH). The amount of water moved per unit of air and time were linearly related when the permeability cups with the films were weighed at regular intervals. According to the equation, WVP was determined in triplicates of each sample.
WVTR=m2−m11440∗r2
where, m2 and m1 are final and initial weight respectively, and r is the radius of the permeation cup.
3.6. Oxygen Transmission rate (OTR)
Prior to testing the OTR, the samples were conditioned for 24 hours at a temperature of 23±2°C and 50±5% RH. OTR was calculated using a Perme OX2/230 (Labthink Instruments Co., Ltd.) under the identical conditions as per ASTM D3985. A digital electronic caliper was used to measure the thickness of the film prior to testing, and the results were entered into the WinPerme OX2-230 W3-330(En) computer application. After the film had been placed in a cell and oxygen flow had been applied to one side of the film, the OTR was measured. The oxygen transfer rate (OTR) (ml m-2 day-1) was computed by multiplying the mean OTR by the film thickness (mm) and dividing the result by the oxygen gradient (1 kgf cm-2) within the testing machine’s cell. Each film sample had three independent analyses, and the mean of those values were taken.
4. Results and Discussion
4.1. Synthesis of Silver nanoparticles
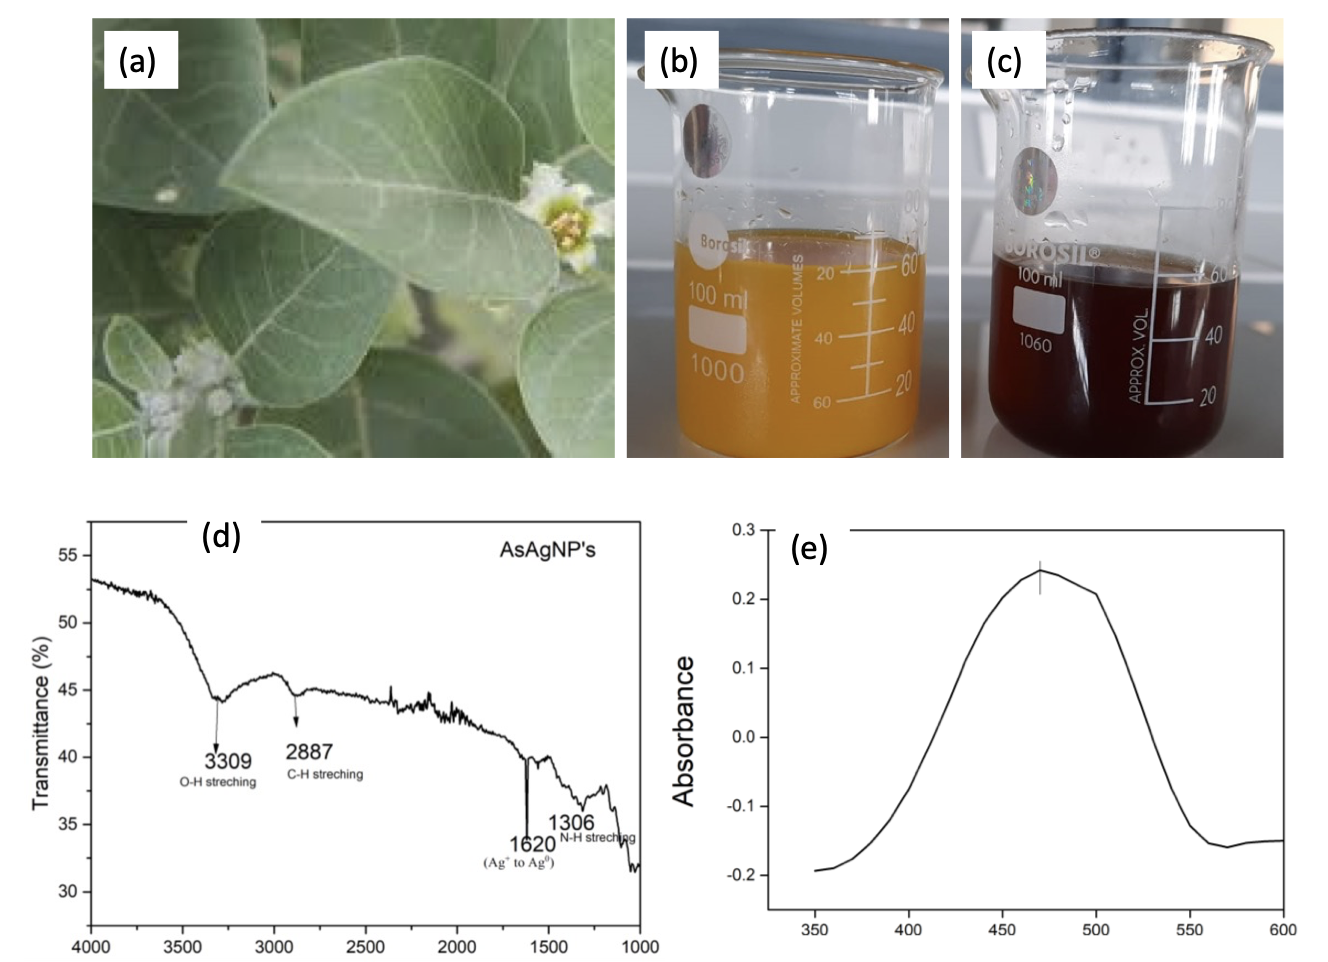
Due to excitation of longitudinal plasmon vibration of silver nanoparticles, the aqueous solution of same appears to be in reddish brown colour. In this work, Ashwagandha leaf extract was mixed with aqueous solution of silver ion complex results in the reduction of silver ion (evident from colour change yellowish green of extract to reddish brown colour of nanoparticle solution figure 2b and 2c).21,24 The formation of silver nanoparticles from Ashwagandha were further confirmed by UV-Vis spectroscopy (Figure 2e). The UV-Vis spectra were recorded after 30 minutes of continuous stirring of aqueous solution in hot plate. Absorption peak at 450 nm indicates the presence of silver nanoparticles and broadening of peak indicates polydispersity.

Figure 2d shows the FTIR image of green synthesised silver nanoparticles from Ashwagandha. The bands at 3309 cm−1 in the spectra corresponds to O–H stretching vibration indicating the presence of alcohol and phenol. Bands at 2887 cm−1 region arising from C–H stretching of aromatic compound were observed.25 The bands around 1740 cm−1 were assigned for C–C stretching (non-conjugated). The band at 1620 cm−1 in the spectra corresponds to C–N and C–C stretching indicating the presence of proteins.26,27 This strong peak at 1620 cm-1 silver nanoparticles is due to the reduction by capping material of plant extract corresponding to methyl 7-oxo-octadecanoate involved in reduction of AgNO3 (Ag+ to Ag0). The band at 1306 cm−1 was assigned for N–H stretch vibration present in the amide linkages of the proteins. These functional groups have role in stability/capping of AgNP as reported in many studies.26–28 The bands around 1040 cm-1 were assigned for N–H and C–N (amines) stretch vibration of the proteins, respectively. The band at 1304 cm−1 exemplifies the N=O symmetry stretching typical of the nitro compound. It may be concluded from the FTIR spectroscopic study that the secondary structure of proteins in the Ashwagandha are not affected because of their interaction with Ag+ ions or nanoparticles.
4.2. characterization of cellulose nanofiber (CNF), and decorated CNF
4.2.1. Scanning Electron Microscopy
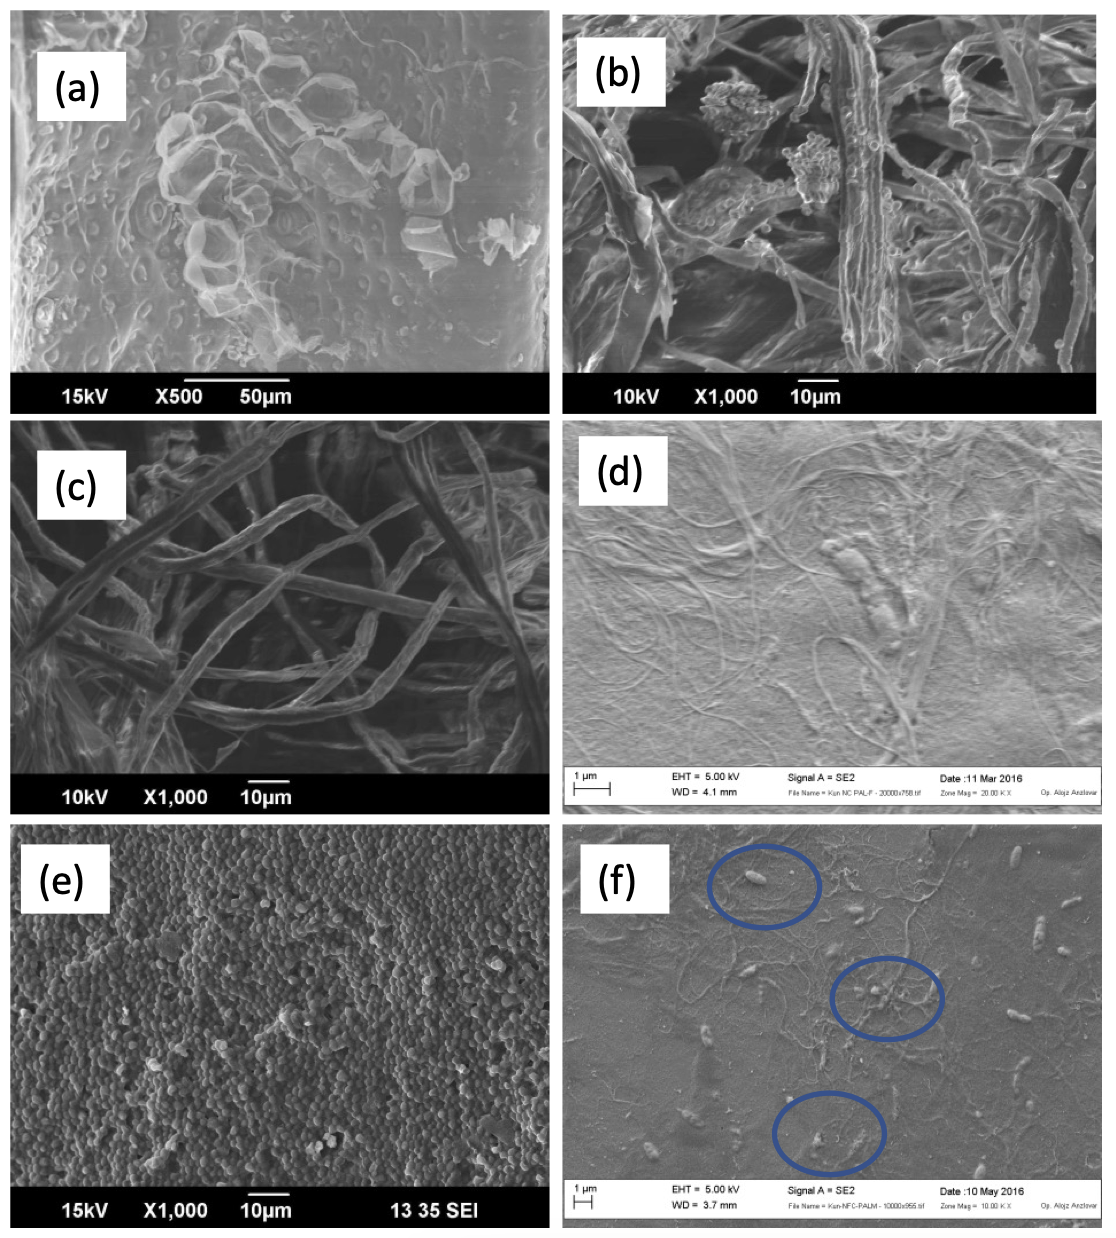
Cellulose nanofibers for the present study were isolated from post harvested pineapple leaf. Pineapple leaves consist of around 60-70% cellulose content.29 Figure 3a shows the surface morphology of milled PALF after washing and drying. We can see rough surface of pineapple leaves which is due to the presence of dust particles, lignin, pectin and other amorphous particles.

During successive physical and chemical treatment, the fibers defibrillated to form single fibers. After steam explosion using alkali, fiber bundles explode to form individual fibers (figure 3b). Wax and pectin which act as a shield to this fiber and fiber diameter reduced after the steam explosion by the sudden release of pressure.20,30 After bleaching, the pulp turns to milky white which is the indication of removal of lignin. Lignin acts as a cementing material to hold the individual fibers. In the presence of bleaching agents, lignin instantly oxidises and leads to the degradation of lignin as its hydroxyl, carbonyl and carboxyl derivatives. After acid hydrolysis, the amorphous content gets dissolved and crystalline cellulose forms (figure 3c). Figure 3d shows the FESEM images of prepared nanofibers after homogenization, which is long slender individual fibers which confirms the formation of cellulose nanofibers.31
Figure 3e shows the SEM images of colloidal suspension of AgNP’s from Ashwagandha prepared at 80°C confirms the formation of uniform spherical particles. The results show the AsAgNP’s prepared by the reduction of AgNO3 with Ashwagandha leaf extract leads to the formation of particles with spherical morphology. The existence of larger particles of AgNP’s is due to the aggregation of nanoparticles which might be induced by the solvent evaporation during sample preparation for SEM analysis.32
4.2.2. Transmission Electron Microscopy
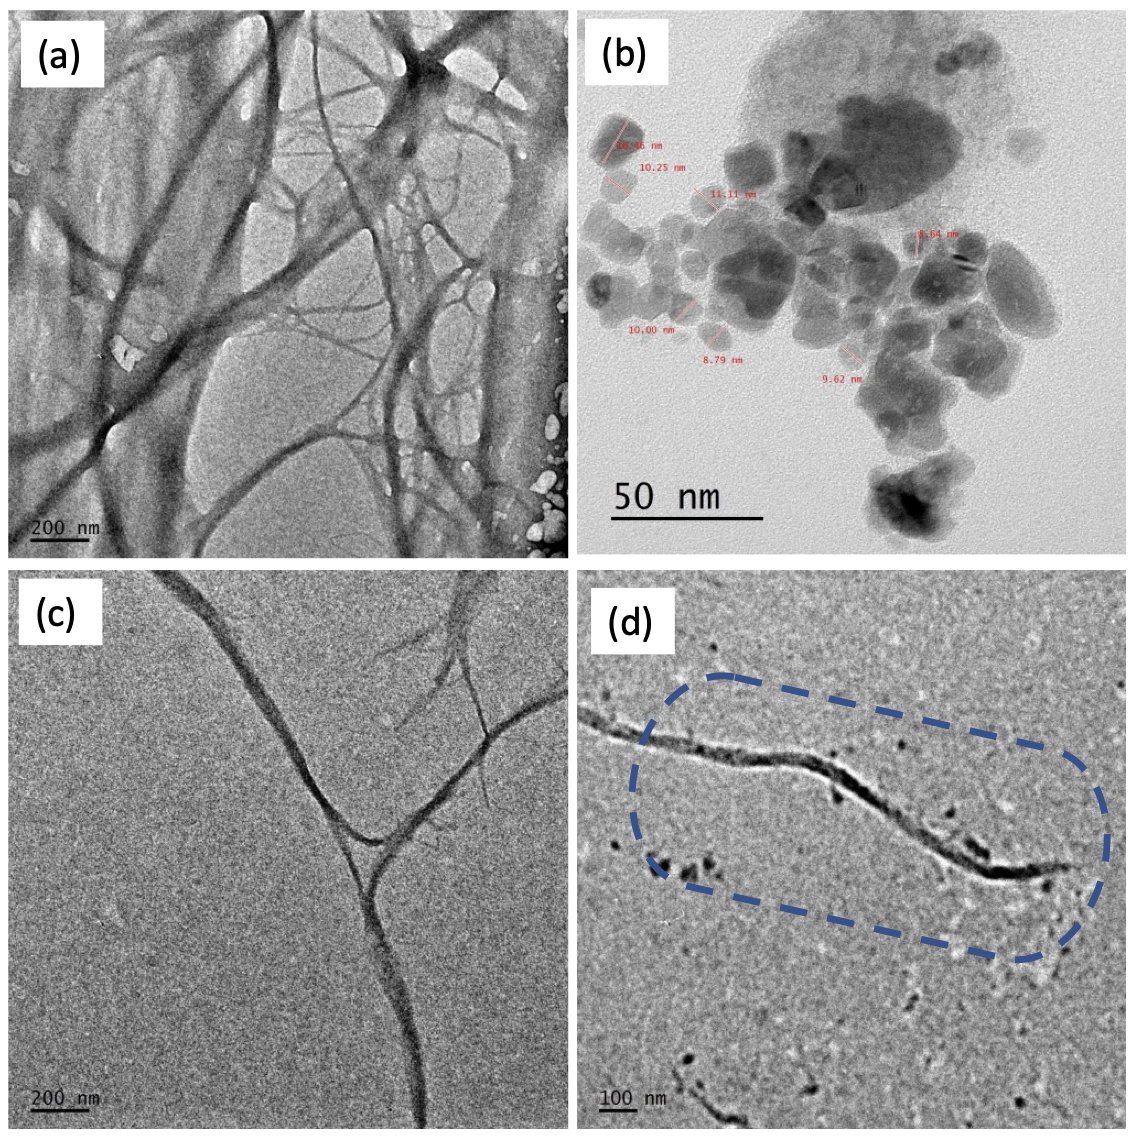
To better understand the formation of nanostructures transmission electron microscopic images were taken. Figure 4 (a and c) shows the image of cellulose nanofibers after acid hydrolysis and homogenization. The figure confirms the formation of long slender interconnecting fibrous structure. The length of nanofibers was unable to calculate due to the interconnecting structure. The long fibrous structure helps to improve the mechanical, permeability and thermal properties of the matrix polymer.20,21,33 Figure 4b shows the TEM image of AgNP’s from Ashwagandha. The AgNP nanoparticles have spherical morphology with slight agglomeration. The size of silver nanoparticles was analyzed by image J software. The average size of nanoparticles is about 9.5 ±2 nm. The aggregation of nanoparticles is due to the tendency to form intermolecular as well as intermolecular interaction with the adjacent molecules.

In this work, Ashwagandha leaf extract act as a capping agent in green synthesis of AgNP’s that shapes the nanoparticles during its growth. The use of medicinal plants like ashwagandha is not only for size and shape control but also for its inherent anti-bacterial activity. The mono dispersion of AgNP nanoparticles revealed that tea polyphenols operate as a capping agent to further lower the size of nanoparticles to below 60 nm in addition to acting as a reducing agent.33 Figure 4C shows the magnified image of cellulose nanofibers and AgNP’s are found to be decorated in the nanofibrils (figure 4D).
4.2.3. Barrier properties
The final performance of films for packing applications is significantly influenced by a film’s barrier qualities. Using a digital micrometer, the thickness of the created nanocomposite films was measured. It was found that the thickness is uniform, which is owing to the solvent casting technique’s homogeneity. To understand the mass transfer process and resolve polymer interactions in edible polymer films, water vapor transmission rate is significant. Table 2 shows that the unaltered films have higher rates of oxygen and water vapour transfer. This is caused by starch’s hygroscopic nature. The water vapour and oxygen transfer rates both decrease with the addition of nanofillers, which is advantageous for the following reasons. Two factors that prevent molecules from entering starch matrices are (1) finely dispersed nanofibers, and (2) lower availability of free hydroxyl group due to strong inter and intramolecular interaction between starch as well as cellulose nanofibers. Since the hydrogen bonding interactions in the composites tend to stabilize the starch matrix when it gets exposed to high humidity atmospheres, the existence of strong hydrogen bonding interactions between starch and cellulose crystallites reduces diffusivity.34 The reduction in permeability is strongly related to a reduction in the diffusion coefficient imposed by the presence of the fibers but also to a decrease in sorption of the penetrant. On the one hand, the increase in cellulose fibril content leads to the formation of denser microcrystal networks thereby increasing the mechanical properties. This dense network should decrease the diffusivity through the sample. On the other hand, by increasing the fiber content, the proportion of reinforcing filler positioning at the surface increases continuously. If the adhesion level between the filler and matrix is not good, it can create diffusion pathways which tend to increase diffusivity of water. Zeppa et al. studied the oxygen permeability behavior of starch nanocomposites where potato starch reinforced with Cloisite 30B (6.25 %) and a relative permeability of 0.87 reported. This is in well agreement with our reported data.35
Table 2 shows that with introduction of a nanofiller, the composite’s relative permeability drops. Improved matrix filler adherence, which reduces free volume inside the matrix, filler dispersion, and the decrease in diffusivity brought on by the added nanofillers, which creates a twisting path for the penetrant gas molecules, are all directly related to the reduction in oxygen permeability. For two main reasons—the penetrant molecule’s diffusivity and its solubility—gas molecules can flow through a polymeric system. The decrease in these two factors has an effect on the penetration of solvent molecules.36
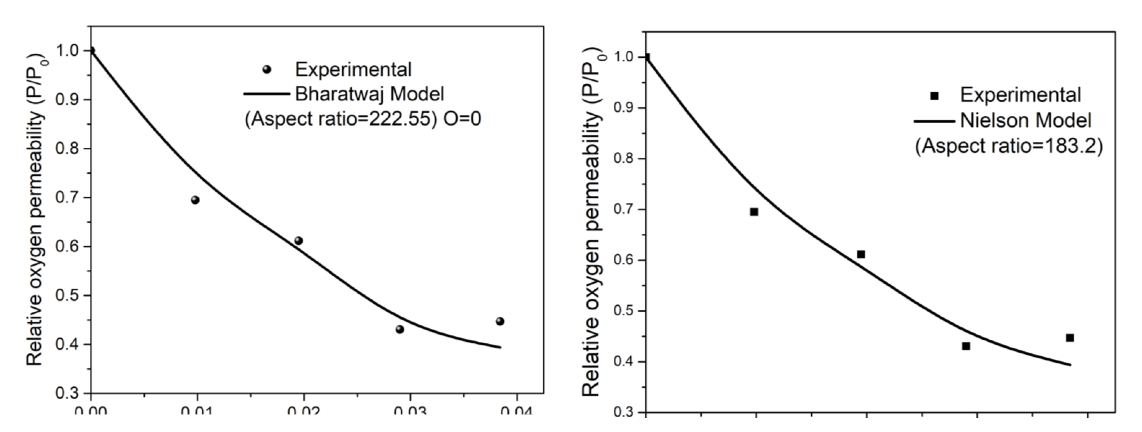
The permeability reduction achieved by nanocomposite by inclusion of nanofillers can be calculated by following Nielsen’s model of tortuosity (equation no:2). The decrease in permeability coefficient directly implies that gases should travel in a long diffusive path. The relation between tortuosity and permeability defined by Nielsen’s as below.37
Where, P and P0 respectively are oxygen permeability of nanocomposite and matrix without nanofiller. is the volume fraction of filler and is tortuosity. Similar findings were earlier reported by Hassani et al.38
Improved matrix filler adherence, which reduces free volume inside the matrix, filler dispersion, and the decrease in diffusivity brought on by the inclusion of nanofillers, which creates a tortuous path for the penetrant gas molecules, are all directly related to the reduction in oxygen permeability. For two main reasons—the penetrant molecule’s diffusivity and its solubility—gas molecules can flow through a polymeric system. The decrease in these two factors has an effect on the penetration of solvent molecules.
PP0=1−∅i1+∝2 ∅i[23][O+12]
Where, = relative permeability
= volume fraction of nanofiller
Aspect ratio of filler
O = orientation parameter of the fillers
This parameter, which ranges from -1/2 to 1, can be used to fit the equation. O = (-) 1/2 denotes fillers equally oriented parallel to the sample film’s plane, while 1/2 denotes fillers uniformly oriented parallel to it (orthogonal arrangement). O=0 for filler particles that are randomly orientated. When O=1, Nielsen’s formula is calculated, which corresponds to particles that are perpendicular to the diffusion flux. This model has been used to estimate how the volume fraction of filler will depend on the permeability of gases. The dependence of the fillers’ orientation and stage of dispersion is not taken into account here. This model describes the relative permeability of gas molecules in relation to the filler volume fraction is given by.6,39
PP0=1−∅i1+α2∅i
The average values of aspect ratio deduced from Nielsen’s and Bharadwaj model and is estimated to be approximately 183.2 and 234.55 respectively (Figure 5). The calculated aspect ratio will have disparities because of orientation, entanglement of nanofiber, flexibility and network structure of CNF. Another possible reason for the inconsistent values could be explained by the limitation of theoretical models which neglects the physical interaction at the filler polymer interface and the chain confinement in this area.36,40

5. CONCLUSION
Starch nanocomposites were prepared by solvent casting technique. Silver nanoparticles were synthesized via green method reduction from Withania somnifera. The formation of silver nanoparticles was confirmed by UV visible spectroscopy and FTIR spectroscopy and a visible peak at 450 nm in UV spectrum confirms the presence of nano silver. The formation of silver nanoparticles was confirmed by TEM images and average size of nanoparticles were calculated by imageJ software. Nano silver adhering to the cellulose nanofiber were evident from TEM images. Barrier properties significantly enhanced due to the fine dispersion of cellulose nanofibers on to starch matrix. The increase in cellulose fibril content leads to the formation of denser microcrystal networks thereby increasing the mechanical properties. This dense network should decrease the diffusivity through the sample. The reduction in permeability is strongly related to a reduction in the diffusion coefficient imposed by the presence of the fibers but also to a decrease in sorption of the penetrant. On the one hand, the increase in cellulose fibril content leads to the formation of denser microcrystal networks thereby increasing the mechanical properties. This dense network should decrease the diffusivity through the sample. On the other hand, by increasing the fiber content, the proportion of reinforcing filler positioning at the surface increases continuously.
Acknowledgements
We wish to acknowledge management and staff of Molecules Biolabs private limited India for constant help and support throughout the execution of work.
Authors Contributions
Dr. Preetha Balakrishnan carried out the fabrication of samples, experiments followed by writing the manuscript. Dr. Sreerag Gopi helped to interpret the data properly and supervised the entire project.
Conflicts of Statement
All authors declare that there are no conflicts of interest.
Data and code availability
Not applicable.
Supplementary Information
Not applicable.
Ethical Approval
Not applicable.